← Back to News
Bridge Technologies VB440 Improves LUFS Display Preserving Context
Published on March 24, 2026
Design in Loudness Monitoring
Executive Summary
- Bridge Technologies describes how design choices in data visualisation can influence interpretation, arguing that interfaces should present truth rather than persuasion.
- The company positions the VB440 as a production tool that combines audio, video, and network visualisations and is accessible through an HTML-5 browser.
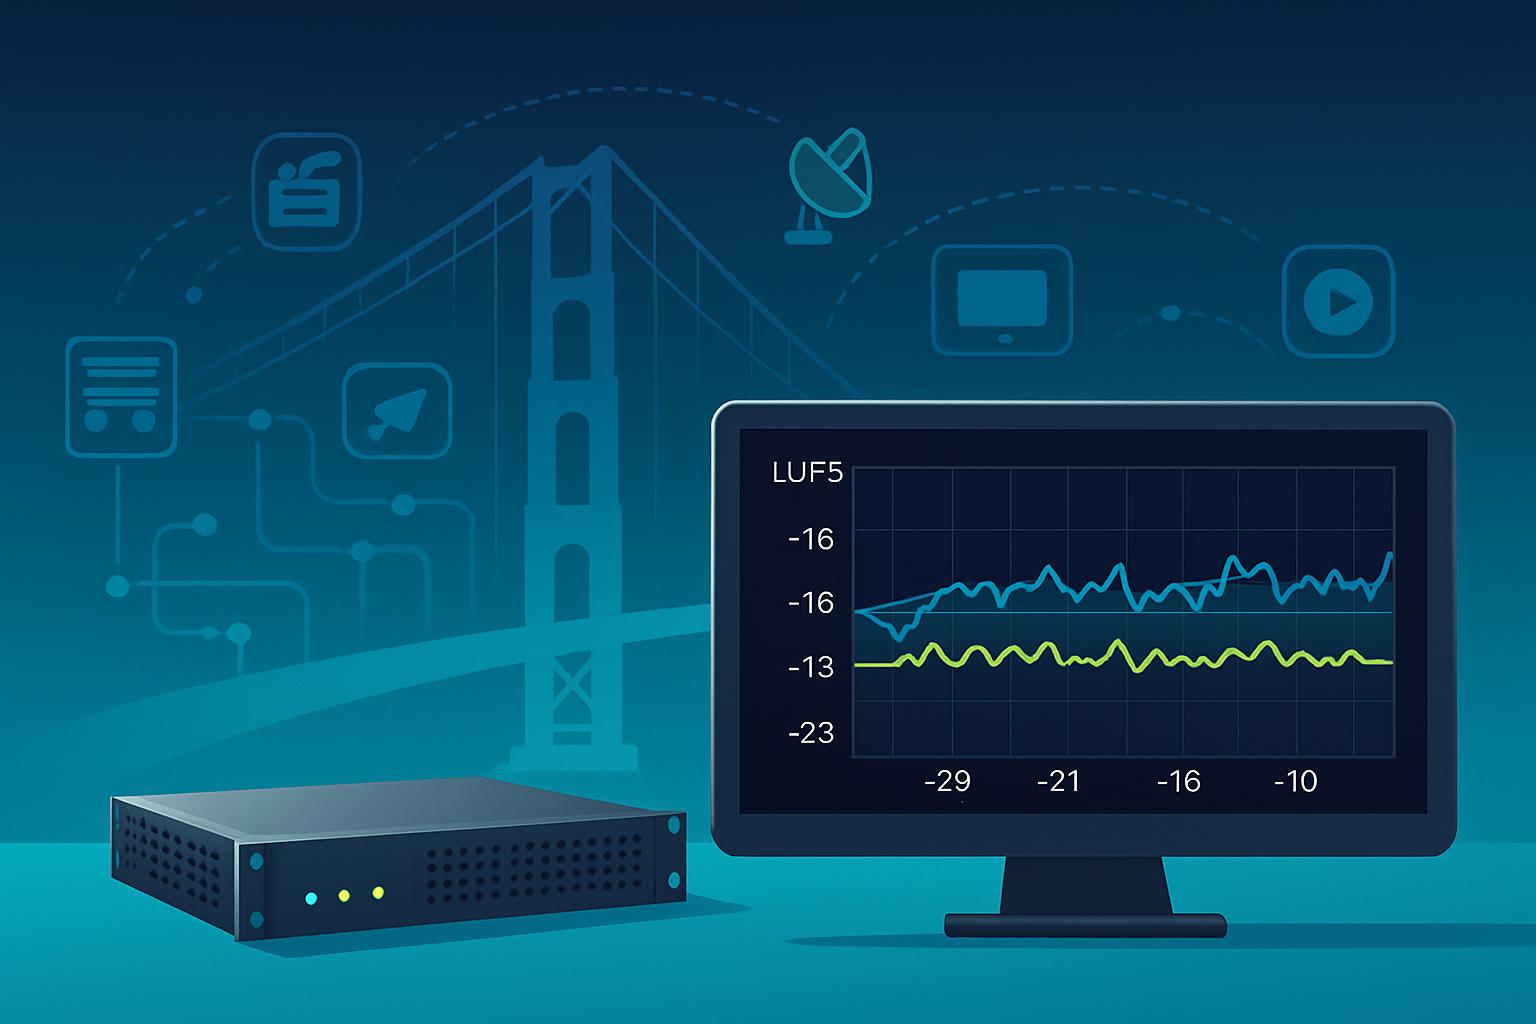
- A described refinement to the VB440 LUFS meter changes how loudness scale adjustments are presented, aiming to avoid misleading impressions when the scale is changed.
- The VB440 LUFS time-based loudness display is described as preserving historical context across navigation and measurement window changes, supporting longer-term interpretation of loudness variation.
Key Industry Developments
- Bridge Technologies frames interface and visualisation design as a factor that can shape how operators interpret technical measurements, with an emphasis on presenting “truth rather than persuasion.”
- The VB440 is described as integrating multiple monitoring domains—audio, video, and network—into a single production tool with visualisations available via an HTML-5 browser.
- A refinement to the VB440 LUFS meter is described as decoupling scale adjustment from the visual footprint, addressing the risk that changing the scale could create a misleading impression of loudness changes.
- The VB440 LUFS time-based loudness display is described as maintaining historical context even when navigating or changing the measurement window, with an explicit range mentioned for preserved context.
Real-World Use Cases
- Remote access to production monitoring: the VB440 is described as allowing users to access and control signals remotely through a browser interface, using an HTML-5 browser for access to audio, video, and network visualisations.
- Loudness monitoring workflows: the VB440 is described in the context of monitoring loudness using a LUFS meter, including a visualisation behavior change where scale adjustment is separated from the meter’s visual footprint to reduce misinterpretation when operators adjust the scale.
- Time-based loudness analysis: the VB440 LUFS time-based loudness display is described as preserving historical context across navigation and measurement window changes, supporting review of loudness variation over time without losing prior context.
- Audio channel and listening workflows: described use cases include soloing individual audio channels and downmixing to stereo for headphone monitoring, alongside real-time visualisation of loudness, phase coherence, and room balance.
Why It Matters
- Monitoring interfaces can influence operational decisions because visualisation choices affect interpretation; the described design goal is to present measurements in a way that avoids persuasion and reduces the risk of misleading impressions.
- Loudness metering is sensitive to how scale and history are displayed; decoupling scale adjustment from the visual footprint is described as a way to prevent a scale change from being mistaken for a loudness change.
- Preserving historical context in time-based loudness displays supports continuity in analysis when operators navigate or adjust measurement windows, enabling interpretation across different time spans (including the stated “10 seconds to 30 minutes” range).
- Browser-based access (HTML-5) supports remote monitoring and control workflows by making audio, video, and network visualisations accessible without describing a dedicated client application in the provided material.
Sources
- https://bridgetech.tv/seeing-sound-why-good-design-matters/
Related News
Haivision Play ISR Premium Accelerates ISR Analysis Workflows
Haivision published a page titled “How Play ISR Premium Elevates ISR Analysis,” indicating a focus on ISR analysis within the context of its Play ISR Premium offering...
Read More →
YES Network uses VB440 to secure ST 2110
YES Network moved from an SDI-based facility design to a SMPTE ST 2110 IP environment at its Stamford studios, using a phased approach that introduced IP alongside exi...
Read More →
MediaKind VOS360 Drives Household Addressable Ad Uplift
MediaKind described two operational themes across video infrastructure and advertising workflows: (1) cloud-connected control for on-premise video infrastructure using...
Read More →